Investigation of important elements in biological networks
- Home
- Downloads
- Installation
- Documentation
- Contact
Investigation of important elements in biological networks
The CentiLib GUI is a panel containing three panels named Assistance, Graph Statistics and Result. Once the GUI is integrated into a tool, it can be used to compute centralities, export computed values to files, get informations about a graph, find important elements in a network and more. For details on the functions of each panel see the appropriate section below.
The Assistance panel allows to compute centralities and export computed values to files or add them as node attributes. It contains a list of available graphs, a drop-down list with possible actions and a list of centralities. To compute node centralities for multiple graphs, one only has to select the desired graphs from the list, choose 'compute centralities' as action and select the needed centralities. If this is done, the computation can be started by clicking the button 'Perform Action' at the bottom of the Assistance panel.
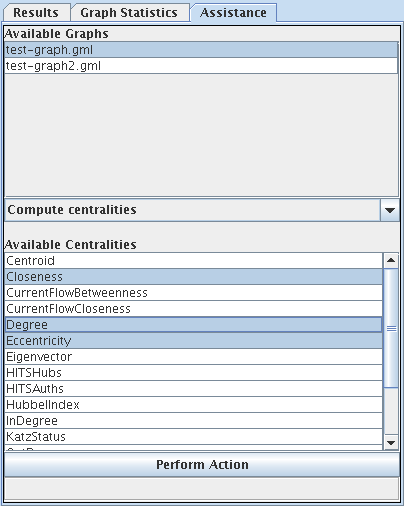
Before starting the computation, CentiLib will ask for needed parameters like the alpha value for the Katz Status centrality. Afterwards the centralities for the selected graphs will be computed without any further user input. When the computations are finished, the results are available in the Results panel (or the Graph Statistics panel if graph centralities were selected).
Exporting values is very similar. The needed graphs and the appropriate export action have to be selected. Afterwards all centralities, which were computed for at least one of the selected graphs, will be shown. If a centrality was not computed for one of the selected graphs, it will be skipped for this graph and no values will be exported.
The Graph Statistics panel contains informations about the currently selected graph. Here one can find out how many nodes and edges a graph consists of and if a graph is connected, loop-free or simple. Also more complex graph properties like the average distance of a shortest path and the Wiener Index are available after computing them via the Assistance panel.
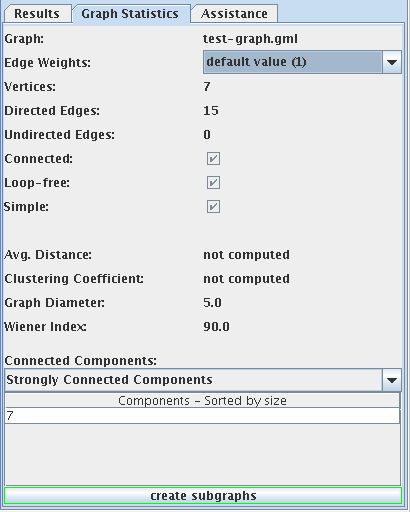
Another feature of the Graph Statistics panel is the possibility to select one of the available edge attributes as edge weight. The drop-down list with the label 'Edge Weights' contains all available edge attributes that have positive numbers as values. After selecting the desired attribute, the weighted centralities can be computed via the Assistance panel. To remove the edge weights the element 'default value (1)' has to be selected from the list of attributes.
The Graph Statistics panel also allows to create new graphs from (strong) connected components of the given graph.
This can be very usefull, because many centralities require connected or strong connected graphs to provide reliable
values. To create subgraphs from connected or strong connected components, select the desired element from the
drop-down list named 'Connected Components'. Afterwards the list at the bottom of the Graph Statistics panel
contains all connected or strong connected components of the given graph. The list is sorted in non-increasing order
by the number of nodes that build the component.
If one or more components from the list were selected, the
appropriate nodes get selected in the graph, too. To create new graphs from the (strong) connected components,
select the desired ones from the list and click 'create subgraphs'.
The Result panel allows the investigation of computatet centrality values. One only has to select the desired graph and
centrality from the drop-down lists at the top of the panel. While the list of graphs contains all opened graphs,
the list of centralities contains only centralities that were computed for the selected graph.
After selecting the graph and centrality, the centrality values of the nodes are shown in a list (see figure below).
The left column contains the node labels and right columns the centrality values.
Because centrality values are based on the structure and edge weights of a graph, the values are only relative.
To ease the comparison of nodes and their centrality values, the average centrality value is given in
the field 'Avg-Value'.
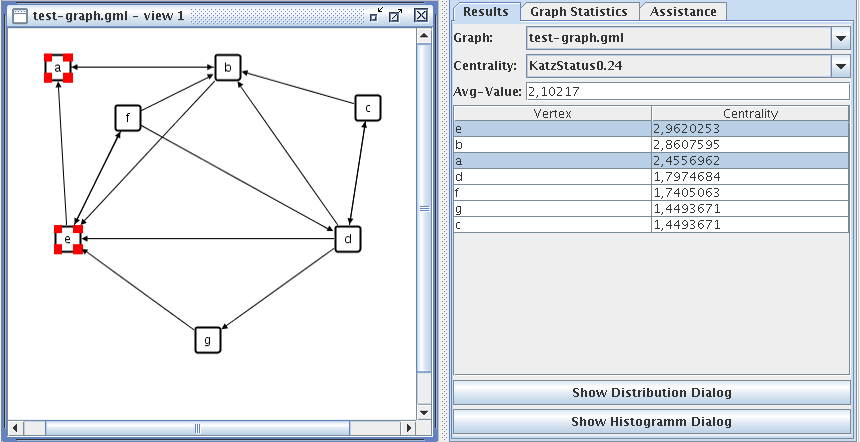
The list of nodes and their centrality values is sorted in non-increasing order by the centrality values. This way the nodes with the highest values, thus the most central, are at the top of the list. To mark the most central nodes in the graph, just select the elements in the list. The opposite diretion is possible, too. If the user selects one or more elements in the graph, the appropriate list elements get selected. Therefore it is possible to easily find a node with a given centrality value and to find out the centrality value of a specific node.
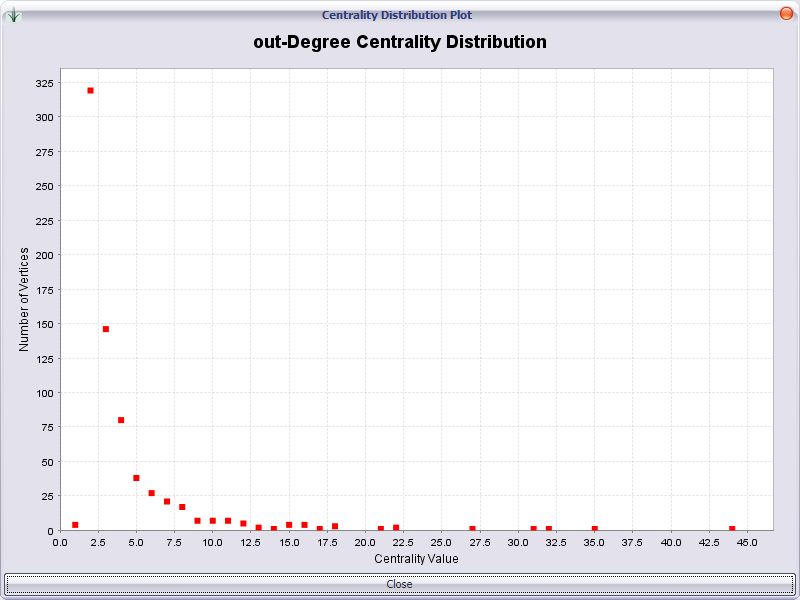
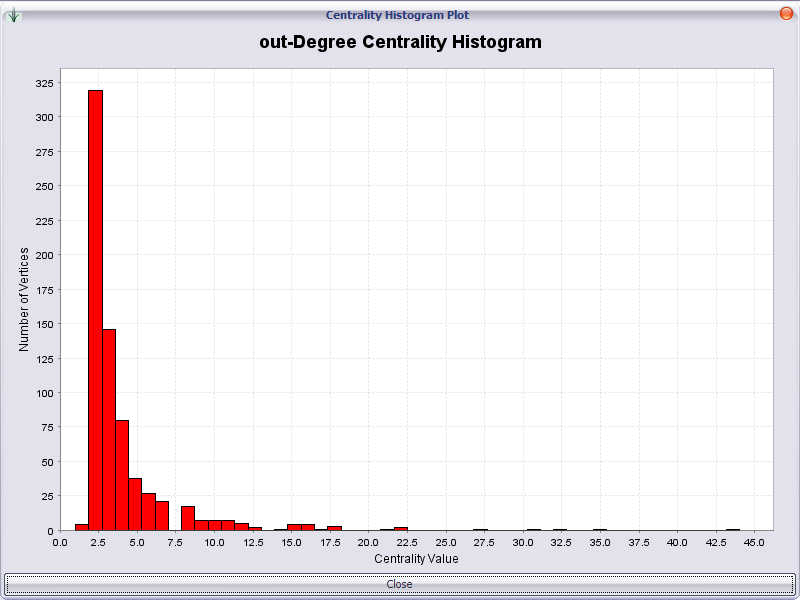
To compare the distribution of centrality values for different centralities or different graphs, one can open a histogram dialog or a distribution dialog by clicking on the appropriate button at the bottom of the Result panel.
|
|