Experimental Implementations
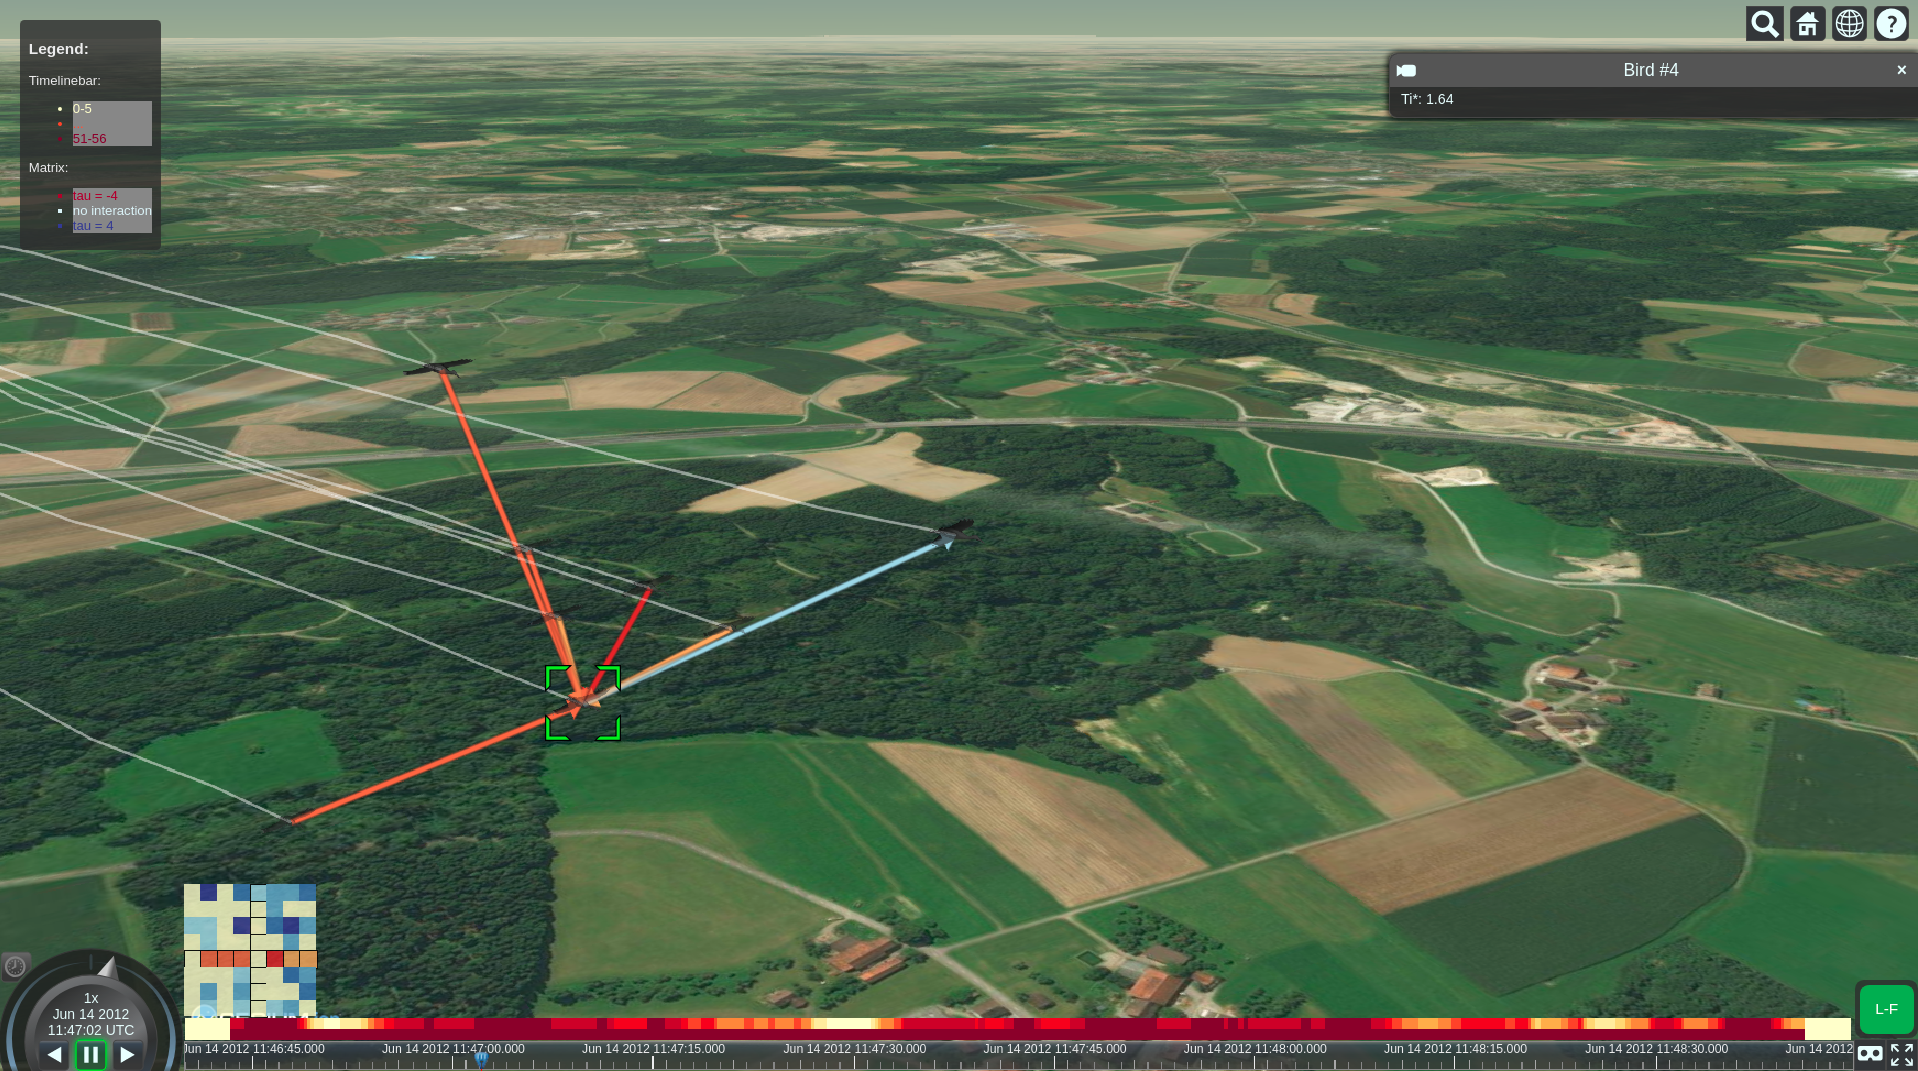
Leader-follower analysis investigates which bird might follow which other bird by analysing the similarity of movement patterns in a sliding timewindow. The current implementation is a stand alone implementation done as a student project. One visualisation shows arrows that indicate the follower relation between a selected bird and other birds, with the color representing the intensity for the relationship, a second one shows the pairwise relations as a matrix. A color coding on the timeline bar shows time windows of high correlation.
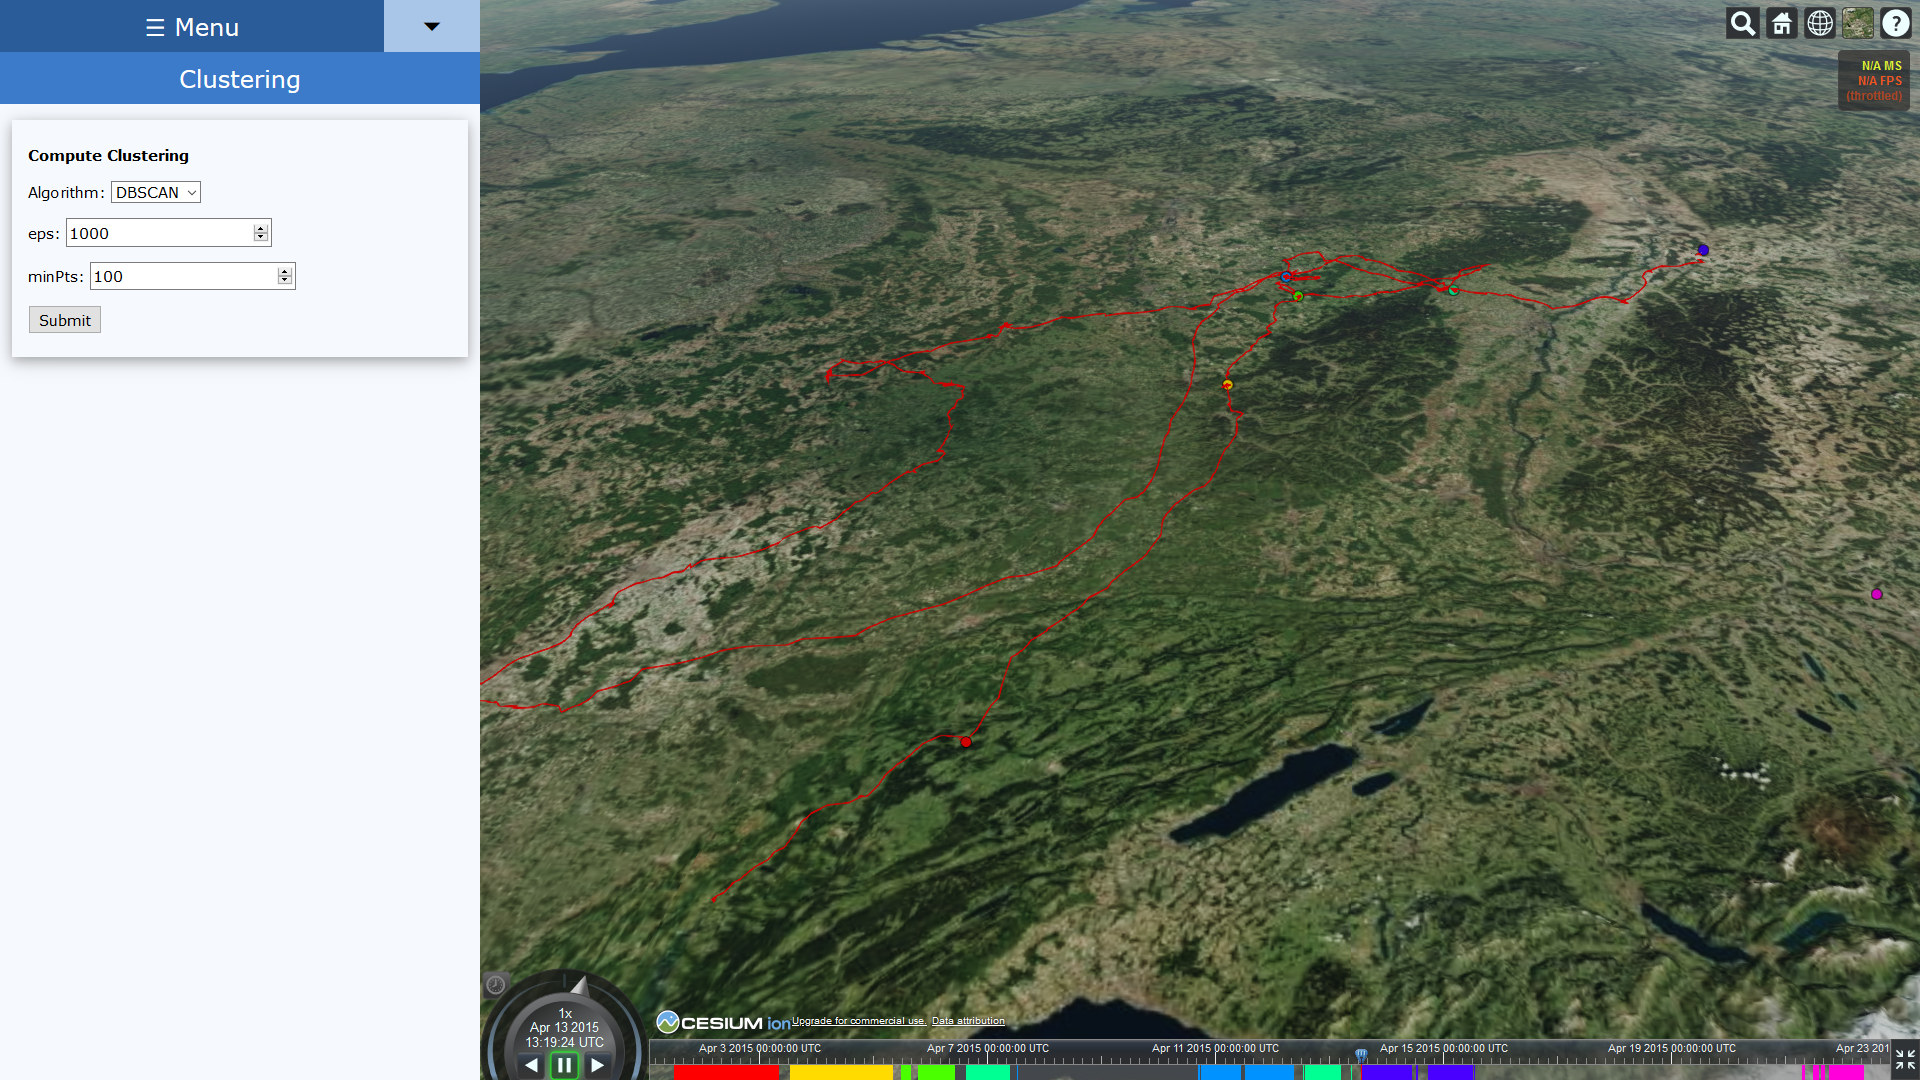
The picture shows the settings of a Clustering algorithm and the visualisation of the result on the timeline bar.
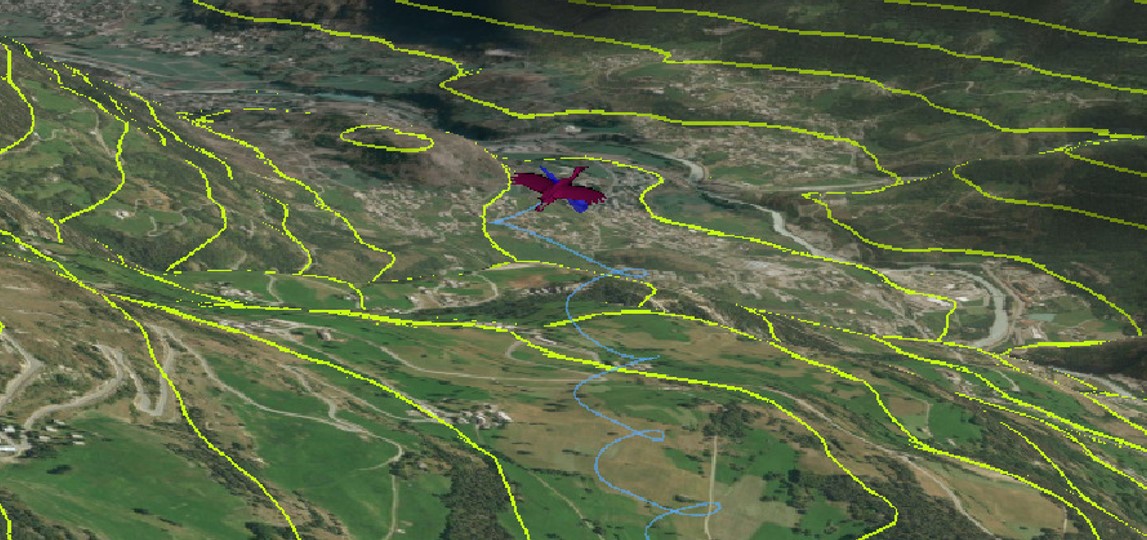
The picture shows an experimental implementation of an orientation indicator , the blue cone attached to the object indicates the moving orientation collected by sensors attached on the animal.
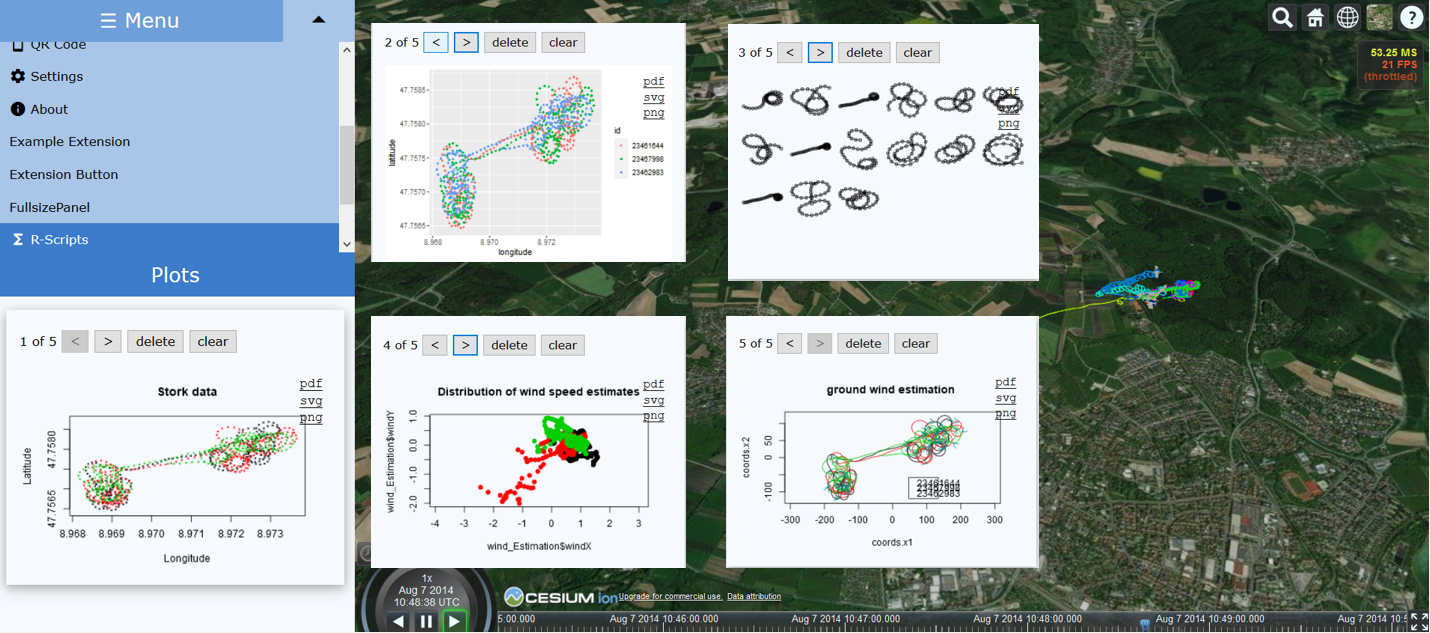
The picture shows the wind analysis using the R extension. We are currently working on mapping the visualisation in TEAMwISE.