|
MAVisto can be started by calling javaws
https://kim25.wwwdns.kim.uni-konstanz.de/vanted/addons/mavisto/mavisto.jnlp
(e.g., from the terminal on Linux or Start/Run from Windows) or by clicking on the address,
if this page is loaded inside a web browser and everything is correctly set up.
|
|
|
|
|
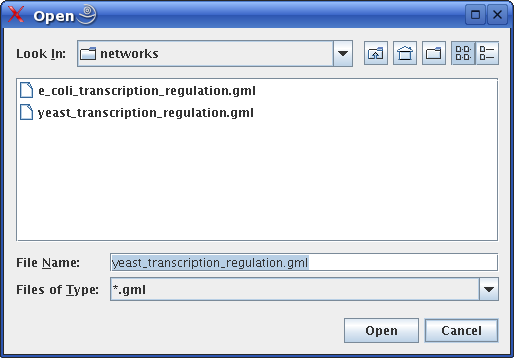
For loading network data from a file, MAVisto supports the
Pajek-.net-
and the GML-format.
Additionally, a simple text file format (each line contains two vertex-identifiers specifying an edge
and optionally a third string specifying the edge label: <ID-source-vertex><ID-target-vertex>[<edge_label>])
can be used to read network data in and than save it in the GML-format.
|
|
|
|
|
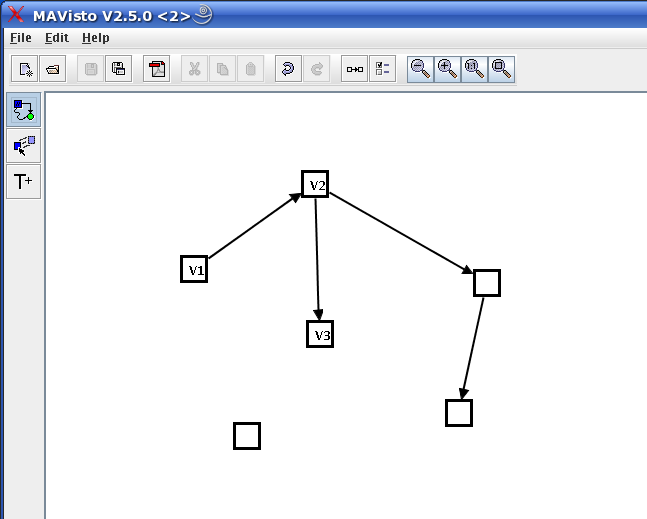
MAVisto offers graph editor functionality for network manipulation
and network creation from scratch, such as adding and moving vertices and edges.
The editor functionality is accessible via the editing tools create, move and label
displayed as buttons on the left side. The tool bar contains a checkbox to specify whether the new graph
is directed or not.
|
|
|
|
|
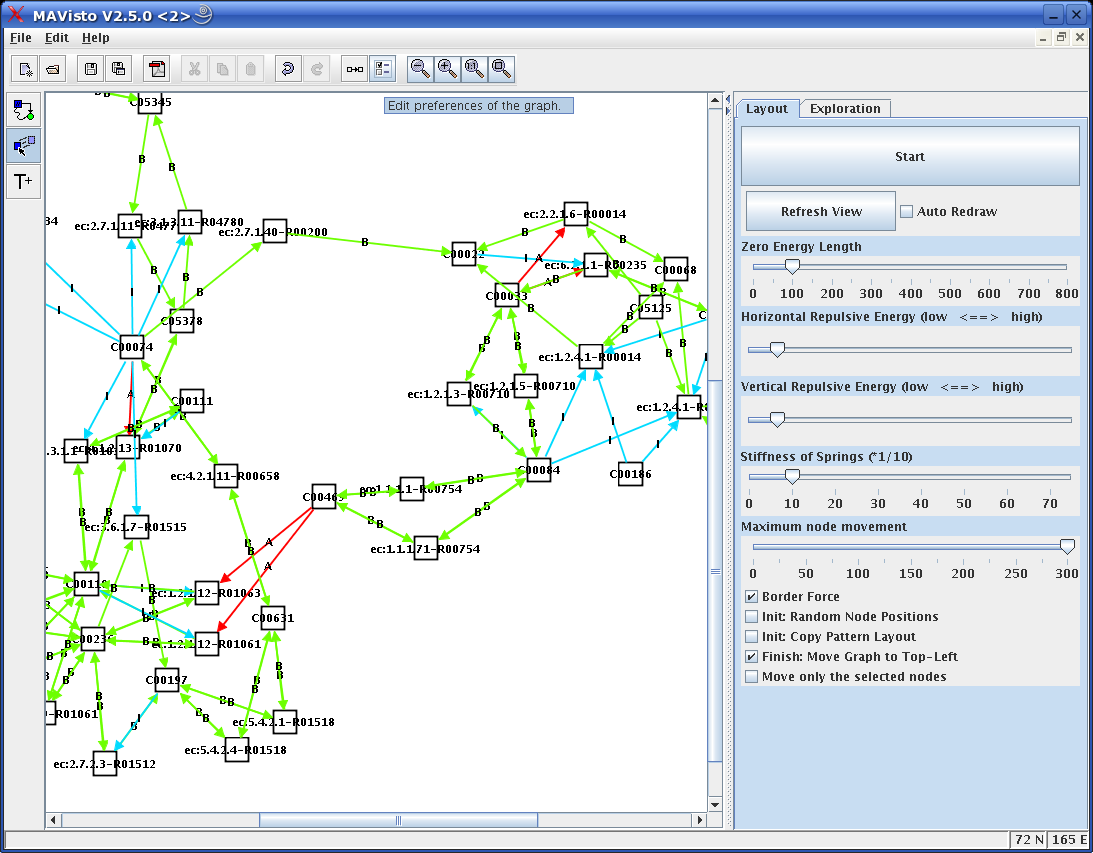
An advanced force-directed layout algorithm is included to generate concise
drawings of the network automatically. It is an implementation of a
spring embedder algorithm and offers different possibilities for adjusting
layout-specific parameters.
|
|
|
|
If the analysed network contains different edge types (identified by their label), these edge types
can be highlighted with different colors to obtain a better overview of their distribution within the
network. Use the button "Edit preferences of the graph" of the tool bar to select colors for the
edge types.
|
|
|
|
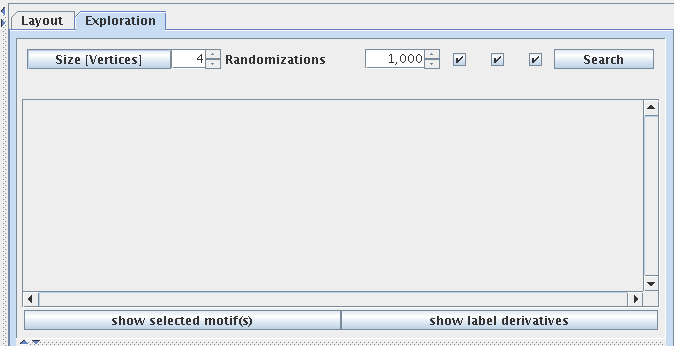
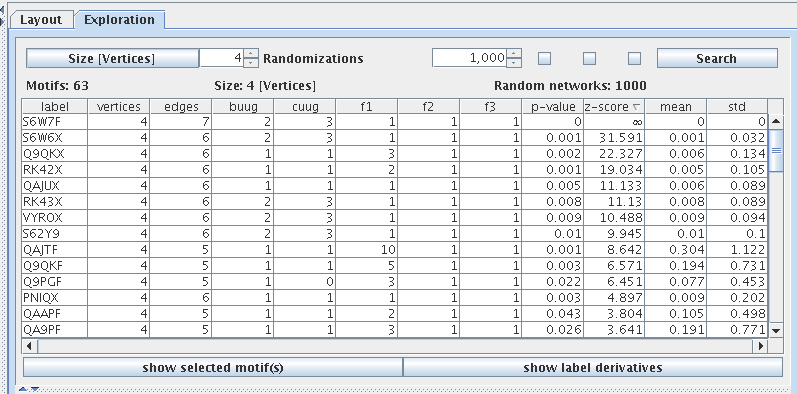
The interface for starting the network motif search is integrated in the Exploration panel.
The following parameters controlling the search can be adapted:
|
Size [no. Vertices / Edges]
|
The size of the motifs to search for, which is either defined as the number of vertices or as the number of edges of a motif.
The current setting is displayed in brackets. This is a toggle button that allows switching between these two possibilities.
|
|
Randomisations
|
Number of random networks to generate for the calculation of P-value and Z-score,
which are measures of the statistical significance of motifs for a particular network.
For a reliable statistics 1000 randomisations are recommended.
Details about the P-value and the Z-score can be found here.
|
|
Checkbox left
|
The checkbox on the left is used to indicate whether edge labels should be considered during the search.
|
|
Checkbox middle
|
The checkbox in the middle is used to indicate whether vertex labels should be considered during the search.
|
|
Checkbox right
|
The checkbox on the right is used to specify if certain edge types (identified by their label) should be excluded from the randomisation process.
This requires that the analysed network contains at least partially edge labels.
|
|
Button search / stop
|
The button to start the search for network motifs. Once a search has been started and
is running, this button can be used to abort the search process.
|
|
|
|
|
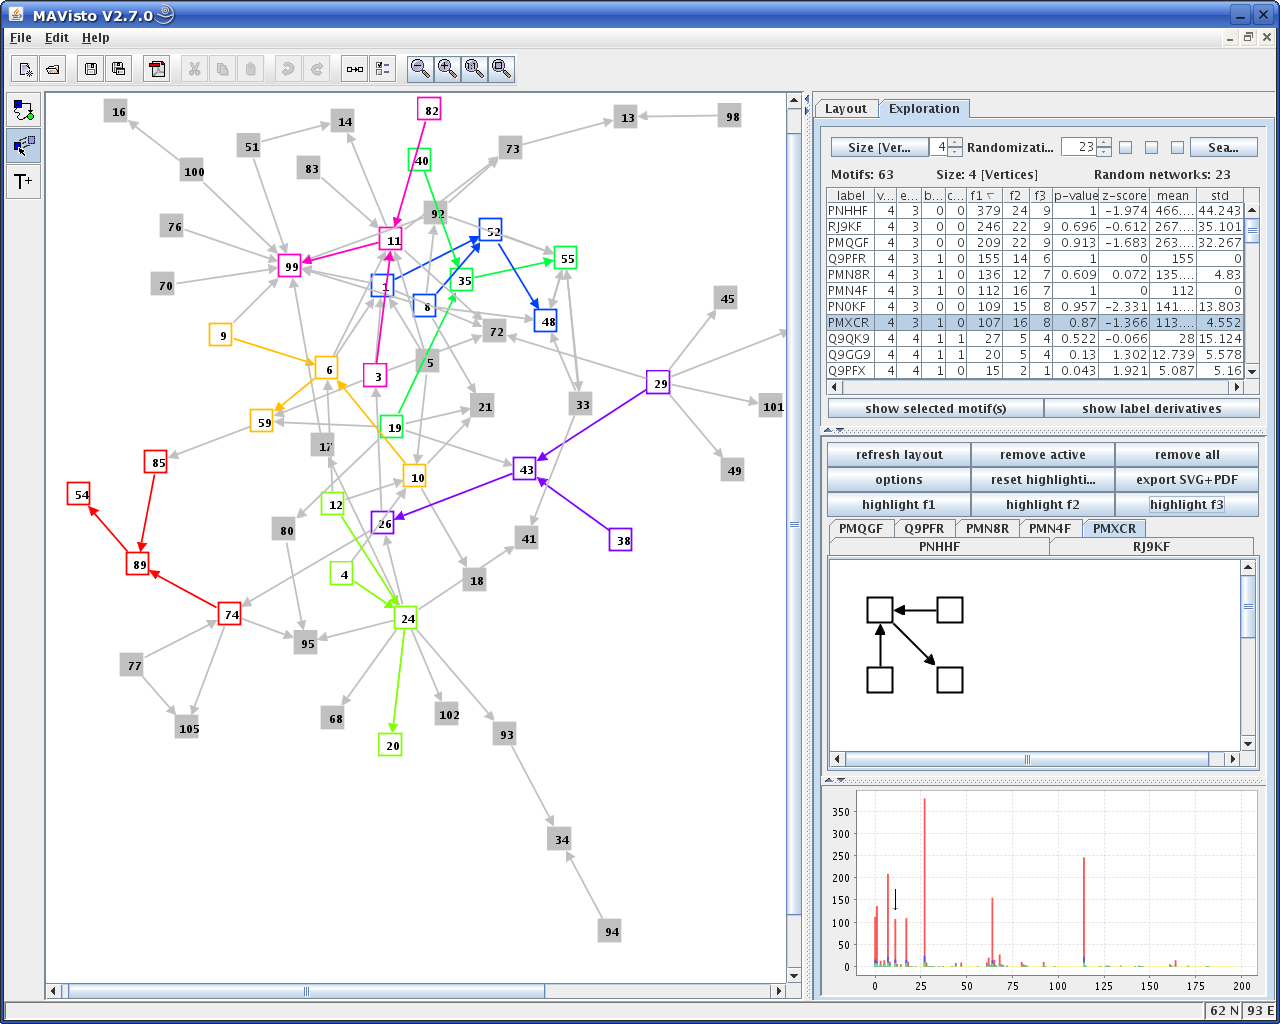
MAVisto provides different perspectives for the interactive exploration of network motifs.
The perspectives motif table, motif view and motif fingerprint allow selection of a motif
and the active motif of the other perspectives is updated accordingly. The perspectives are:
- Motif table
- Motif view
- Motif fingerprint
- Motif matches
|
|
The motif table lists information about the discovered motifs
of a search. The motif table supports sorting by all criteria
and selecting of motifs to be displayed in the motif view. The following
information is presented:
|
|
Label
|
A string representing a unique identifier for each motif.
|
|
Size
|
The size of each motif is given by the number of vertices and edges.
|
|
Structure
|
Information about the structure is given by the number of
branches (buug) and cycles (cuug) in the underlying undirected graph.
|
|
Frequency
|
The frequency values of each motif are listed for the three different
frequency concepts F1, F2 and F3. A comprehensive description of the
frequency concepts is available at this site.
|
|
Statistics
|
Information about the statistical significance of motifs is given by the P-value and
the Z-score, which are calculated based on the comparison of the motif frequency
in the analysed network (using concept F1) to the frequency distribution in the randomised networks.
A more detailed description of the P-value and Z-score calculation and the randomisation algorithm is presented
at this site. Furthermore, mean value and standard deviation of motif frequency in
randomised versions of the network are presented.
|
|
|
|
|
Actions
|
|
Show selected motif(s)
|
This button is used to display the selected motif(s) of the motif table in the motif view.
|
|
Show label derivatives
|
Shows the different motif label derivatives of the selected motif. Motif label derivatives differ
in the labels of their edges and/or vertices. This function requires that the search for motifs has
been performed under consideration of edge labels, vertex labels or both, edge and vertex labels.
If label derivatives of one motif are shown, this button can be used to return to the normal motif table.
|
|
|
|
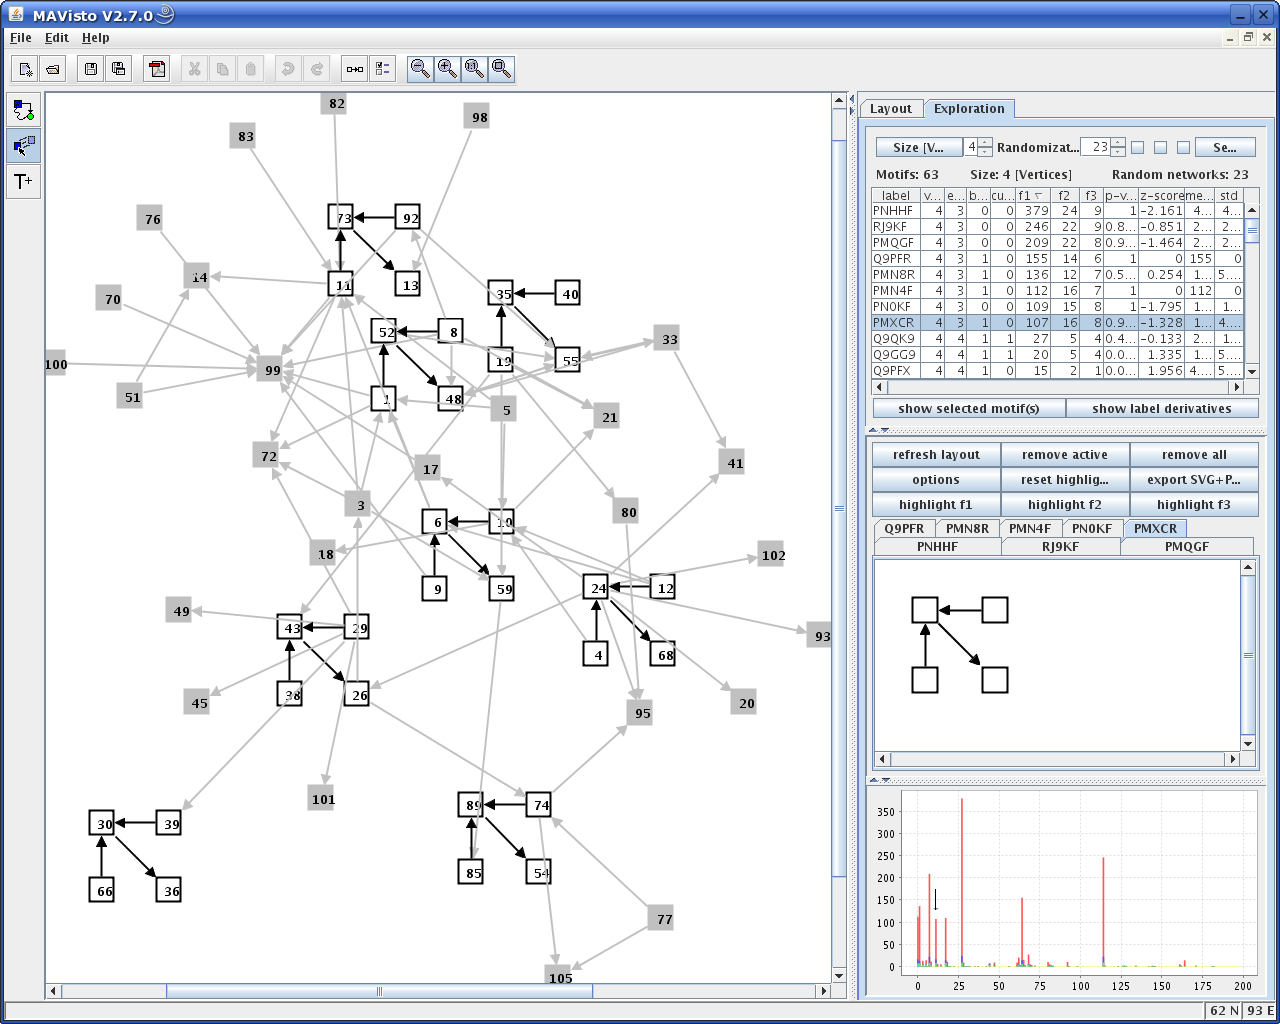
The motif view provides a visual representation of the structure of motifs. Displayed motifs can be laid out
and highlighted in the analysed network. The available options are:
|
|
Layout
|
An automatic layout of motifs is calculated using a force directed algorithm. Alternatively, the
layout can be adjusted manually by selecting and moving the vertices of the motif.
|
|
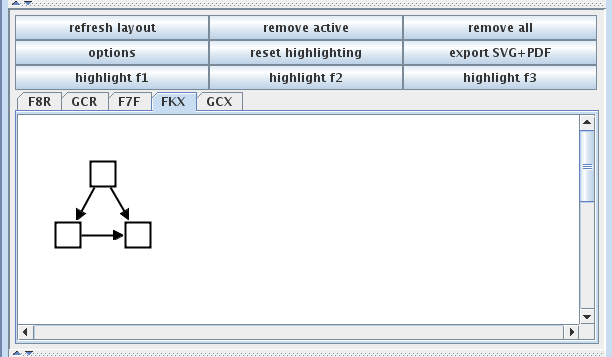
Removing of motifs
|
The active motif or all motifs displayed in the motif view can be removed.
|
|
Options
|
This starts a dialog where it is possible to define some options for the appearance of the
highlighted motif matches in the target graph:
- Mode of element marking: use color or gray values for highlighting the coverage of
network elements by motif matches or for highlighting network elements of individual matches.
- Marking of individual elements: in some cases network elements can be assigned to individual
matches (edges for frequency concept F2, nodes and edges for frequency concept F3). It is possible
to use different colors for the elements of each highlighted match or a uniform color for all elements
of the highlighted match.
- Color of unmarked elements: the color for the network elements which are not covered by the
highlighted motif matches.
|
|
Export SVG + PDF
|
Exports the currently displayed motif in the SVG and PDF file format.
|
|
Highlighting(F1, Ff2, Ff3)
|
Highlighting of the matches of the active motif within the analysed network, which is described
below. For a description of the frequency concepts please visit
this site. The highlighting of the matches can be reseted.
|
|
|
|
|
|
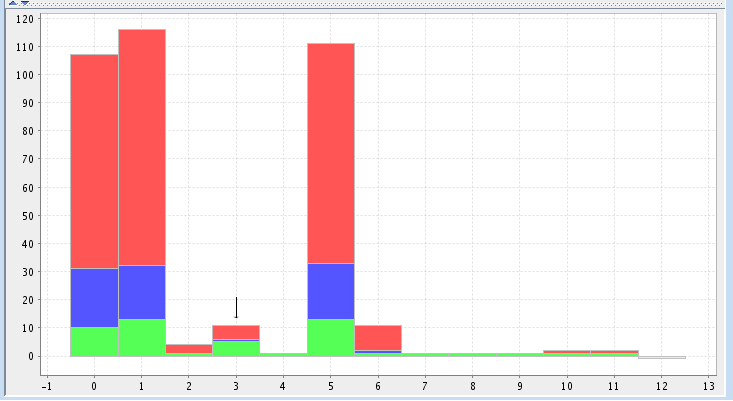
The motif fingerprint represents the motif frequency spectrum of the
analysed network as a diagram. The fingerprint comprises all motifs
of a particular size and plots the motif frequency values of the
motif table. The order of the motifs is defined by the
alphanumerical order of the motif label, taking both the supported
motifs and the motifs with frequency zero into account. This
guarantees the comparability of motif fingerprints of different networks.
The values for the three frequency concepts are plotted as stacked columns and
are represented by different colors: F1 as red column in the back, F2 as blue
column in the middle and F3 as green column in the front. If a color is not visible, it
is fully covered by column in front of it and has the same value, since the
values for the frequency concepts are monotonically decreasing from F1 to F3.
Motifs not supported by the analysed network are displayed as a yellow column
with frequency -1. The active column is indicated by an arrow on top.
|
|
|
|
|
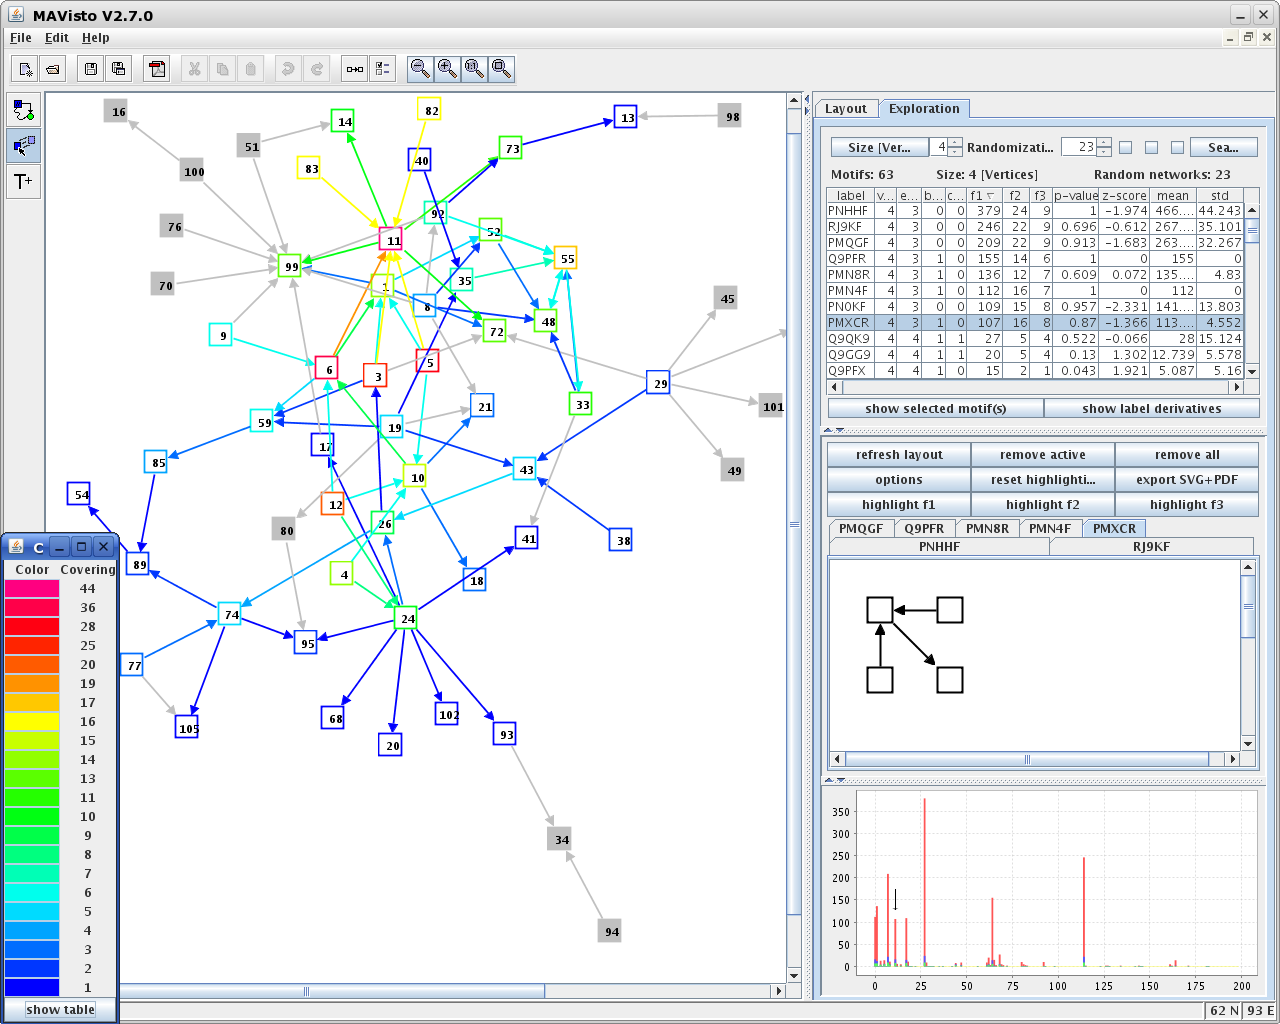
For the visual exploration of the occurrences of
a motif within the analysed network, highlighting of the matches,
respectively the coverage of network elements by the matches,
is provided, depending on the applied frequency concept:
|
|
Frequency concept F1
|
Concept F1 does not restrict the sharing of network elements, therefore
network elements can be part of different overlapping matches. The network
elements are highlighted according to their coverage by matches of
the selected motif using colors or
gray values. The colorbar shows the
mapping of coverage values to colors and provides the possibility to show
a table with the coverage values of the vertices.
|
|
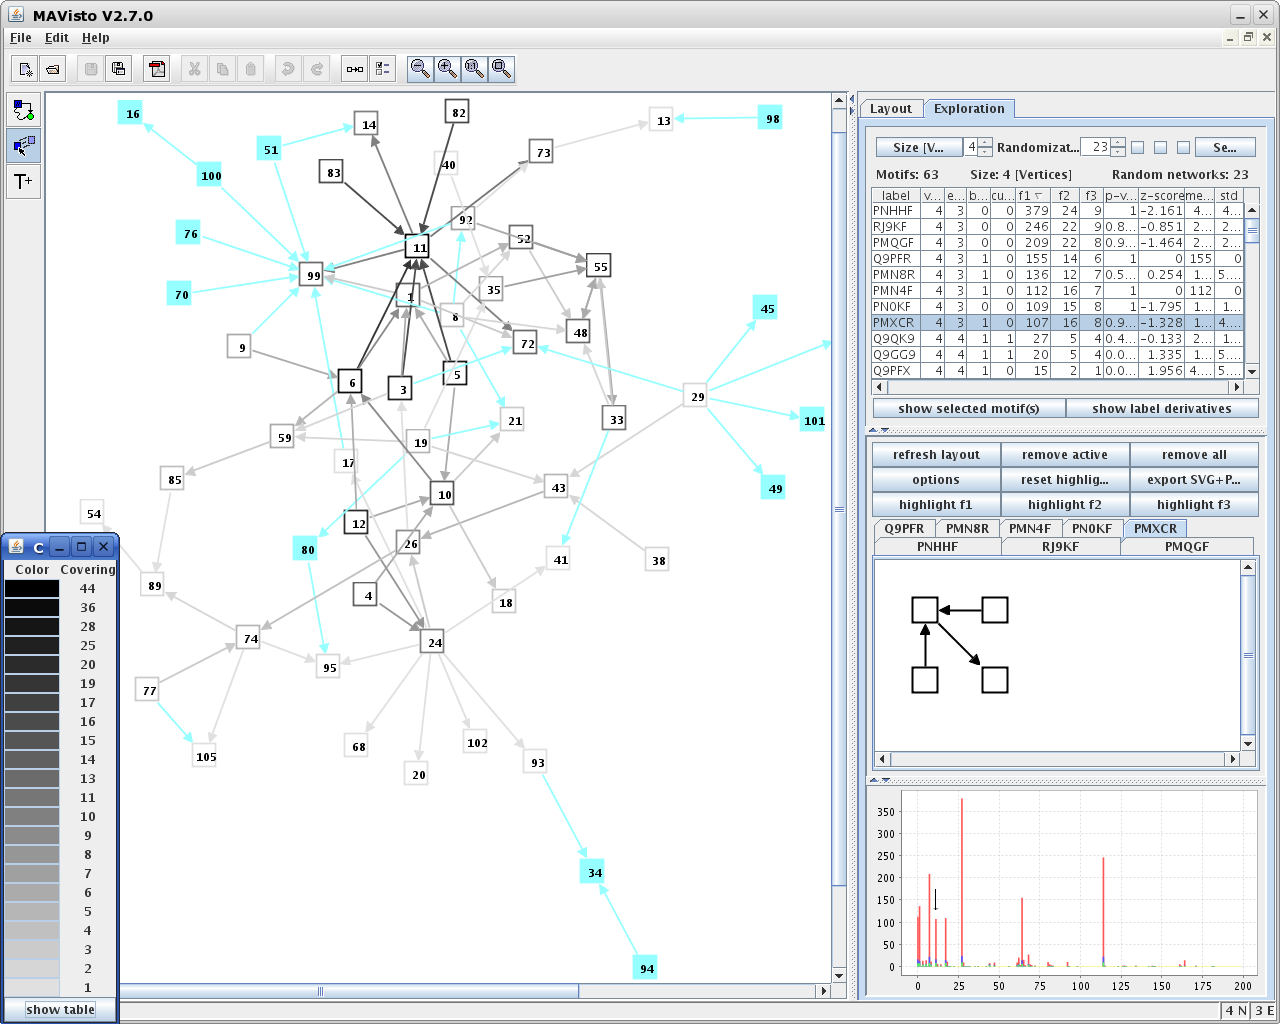
Frequency concept F2
|
Concept F2 allows the sharing of vertices by different matches, but edges are
assigned to individual matches. Therefore, vertices are highlighted according to their
coverage by the selected matches. The colorbar shows the mapping of coverage values
to colors. Edges are marked either individually
or uniformly. In case of an individually marking,
all edges of a particular match are displayed with the same color. Please keep in mind
that the colors used for the vertices and for the edges have different meanings for
frequency concept F2 and should not be confused.
|
|
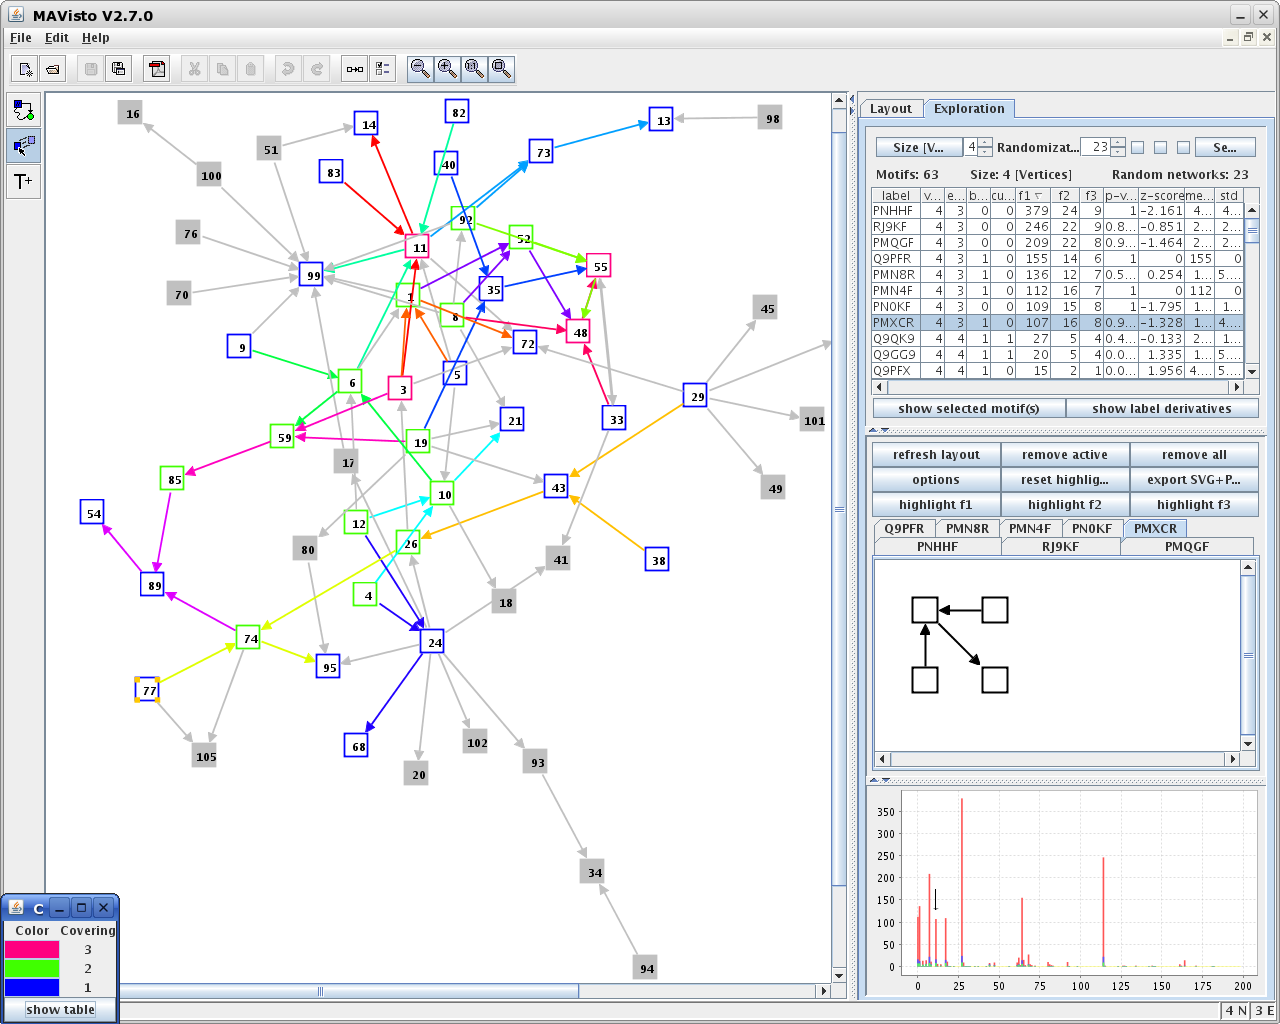
Frequency concept F3
|
Concept F3 does not allow any sharing of network elements for the selected matches.
Therefore, network elements are uniquely assigned to individual matches and can be
marked with different colors or the
motif preserving layout can be applied.
The motif preserving layout copies the layout of the motif in the motif view to
all selected matches in the analysed network, which then gets newly laid out.
Use the option "Init: Copy Pattern Layout" in the layout panel after highlighting
the matches of frequency concept F3.
|
|
|
|
|
|
|
|
|
|
|
|
|
|
|
|
|
|
|
|
|
|
|